Topsy released its new social media analytic tool a few days ago, and I thought the debut of the second season of NBC’s “Who Do You Think You Are” would be a great test of the type of metrics this new statistical tool can provide.
Who Do You Think You Are, or abbreviated as WDYTYA, is an NBC show based upon a BBC hit of the same name. Sponsored by Ancestry.com, the largest purveyor of genealogy information on the web, this show takes a look into a celebrity’s research into their family history. While initially that may not sound interesting to most people, this reality tv show does this by taking the celebrity to their ancestors home town and other historical areas. It actually becomes quite an intriguing look into the celebrities ancestors and the part they played in the history of the world.
I think this is a great subject matter to research because it may instantly give us an idea of the popularity of the show in comparison with other shows as it relates to twitter posts. It may also help highlight how a site such as Ancestry.com and the celebrity’s themselves may have also benefited from the showing. As a final note, I’ll take a look at how much interest the show may have generated by comparing genealogy specific keywords. So let’s take a look, shall we?
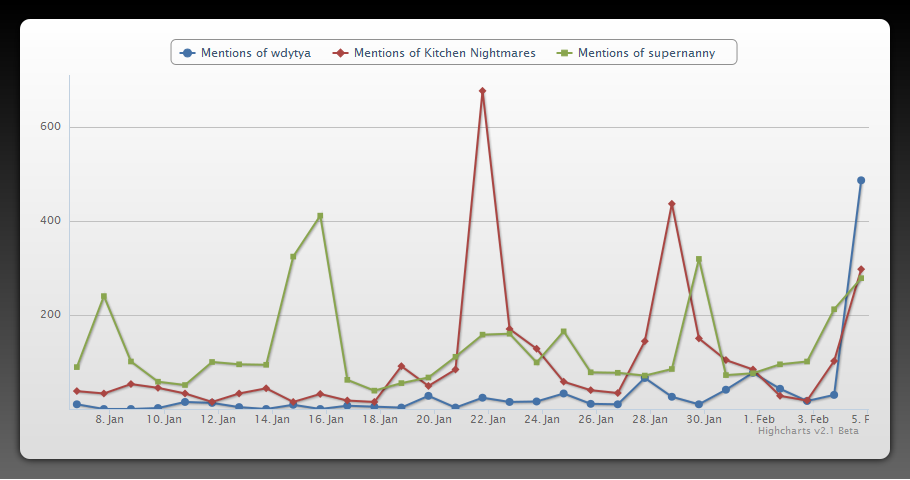
The initial image shows a comparison over the past month of names of three tv shows which all showed Friday, 5 Feb . 2011 at 8pm. I chose to not use “The Defenders” which aired on CBS because the Topsy search negates the word The and just used Defenders. That produced a high quantity of not-related tweet results. So the three shows I used in this example were Kitchen Nightmares on Fox, Who Do You Think You Are on NBC (by searching for WDYTYA), and Supernanny on ABC.

The results above shows the popularity of each show as it relates to tweets. Some caveats to mention. WDYTYA’s second season premiered on 4 Feb. 2011, Kitchen Nightmares Season 2 premiered on 22 Jan. and had its third showing on 4 Feb. Supernanny is in season 7, and showed episode 10 on 4 Feb.
Suppernanny’s results were less then accurate, though not as great an issue as it was with the Defenders. The fact that it was also the 10th episode of the season likely also hurt its rankings.
The results above show a significant interest in WDYTYA in the twittersphere, over previous days. It’s numbers indicate a higher interest in that show, then the other two shows. The question is, does that reflect accurately the shows viewership using more traditional methods such as Nielson Ratings?
Nielson initial results for that night shows using the Live Viewer ratings, showed that the top show of those three for the night was in fact WDYTYA with 7.291 million live viewers (or same day watchers in case of DVR), in comparison with Supernanny at 4.354 million and Kitchen Nightmares at 3.945 million. The Defenders was actually the most watched show during that time period maybe because it was the only non-reality tv show airing on the major networks?
When we take the Nielson numbers with the chart above, we do see a correlation between the numbers with some minor deviation. I was actually surprised that the chart did reflect the interest in WDYTYA, because the general audience of this show is much older then most shows. In fact it ranked 3rd in the 18-49 viewership, which I would expect since genealogy as a hobby is done by older adults… generally over 50.
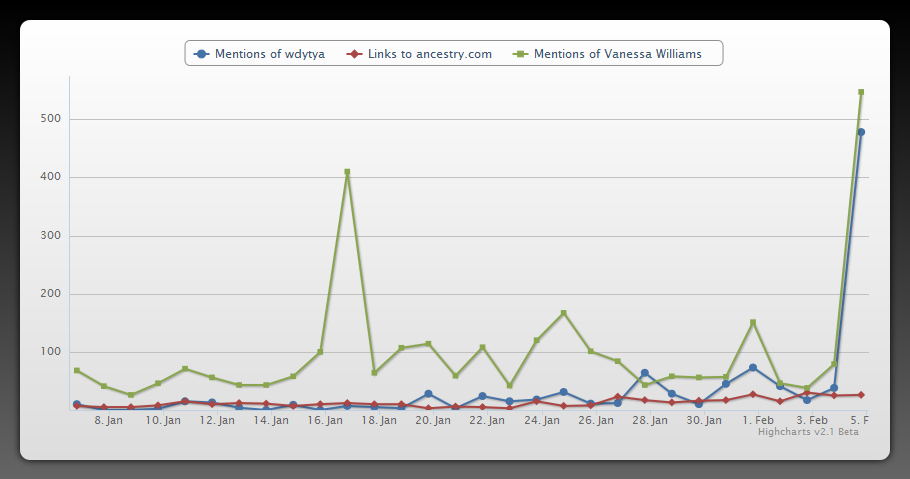
The second chart I want to take a look at is going to investigate how much of a boost the season premier may have done for both Ancestry.com and Vanessa Williams, the celebrity for the night.

These were quite interesting showing the increased interest in both WDYTYA and Vanessa Williams. Ancestry.com itself showed about a 2x normal interest, however that does not compare to the numbers shown by the other two matches.
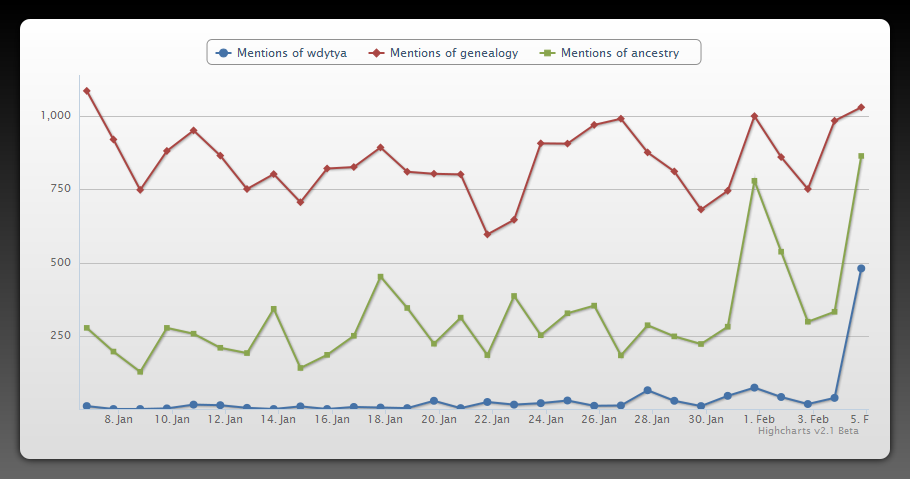
One of the purposes of the show “Who Do You Think You Are” is to increase the interest in genealogy overall. The final chart I’m showing here will give an idea on whether that has succeeded, at least in the twitter world:

While tweets using the word genealogy did not increase, those using Ancestry certainly did, and there was an overall increase or interest in the genealogy hobby reflected on Twitter.
I would like to hear your ideas on how you think this new analytical tool can help you in your web development!